15 Oct Radar Imagery and understanding how they work
Radar imagery is one of the most iconic, if not the single handedly most iconic and used tool when it comes to weather. The addition of smart phones and apps has exponentially increased the use of weather radars across the world as now everyone has one in their pocket and just a click away. But… the question still begs to ask, do you know how to use a radar and what exactly you’re looking at? Most people know that the colours represent rain, but there are many other features that radars can show which are paramount for understanding weather and how it works. There are also many tricks to the trade to avoid mishaps with radars. This will answer some of those questions, shed light on some of those theories and help increase the knowledge of the average person when using radar imagery.
How do radars work?
RADAR stands for RAdio, Detecting and Ranging and the simplest definition of a radar is that it uses radio waves ejected from a transmitter out into the region which then bounce off rain and other objects and return to a receiver where they appear on an imagery screen. When they move through precipitation, part of the radar beam which is being ejected is scattered through that precipitation and then returned to the radar where it signifies where the precipitation is, how strong it is and due to the 360º rotation of a radar beam we can also see how large the precipitation is.
Radar beams when they intercept precipitation have the ability to read and understand the density of the precipitation, the amount of particles there are, the size of the precipitation particles and this can allow the radar to return valuable data to the Bureau of Meteorology to help them understand whether light, medium or heavy rain is occurring, or if its hail which may potentially be large and warrant a severe thunderstorm warning.
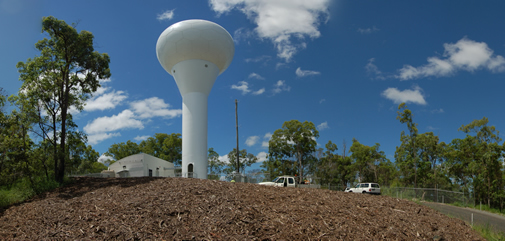
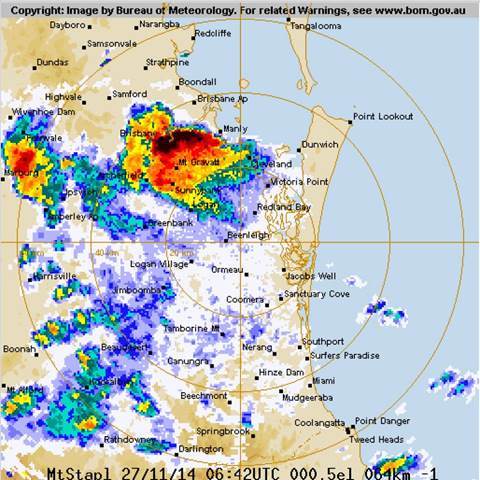
Mt Stapylton Radar via BOM
Radar beam limitations:
Its important to understand also that the beam doesn’t always reflect whats happening at the surface. The radar beam is at a very slight tilt and so the closer you are to the radar dome, the closer the beam is to the surface… the further away from the radar you get, the higher into the atmosphere the beam is projecting and this can sometimes give the illusion of heavier or lighter precipitation (and sometimes none of its reflecting above the clouds height). The beam also cant travel through solid objects, so rainfall situated behind ranges or mountains may be slightly obscured. To avoid this being a detrimental issue, the Bureau of Meteorology conduct a series of scans and construct them together to project a single image. The radar rotates 360º once every 20 seconds, it does 14 sweeps per set, increasing slightly with elevation each time. The radar image that becomes presented on our screens and phones is a composite of the lowest 4 sweeps in a set.
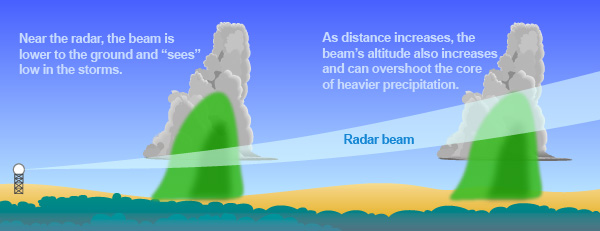
Radar beam mechanics showing how they work with distance via the National Weather Service
Rainfall Rates & Intensities + their Colours?
When looking at a radar, its important to understand the colour guide. Many people use different radar origins, with the Bureau of Meteorology and Weatherzone being the two most common due to their easy access and smartphone capabilities. While the colour scheme is different, its important to know these are identical for their representation… the Bureau of Meteorology is the only company in Australia which physically owns radar domes so regardless of the site.. its still showing the same intensity. The following will be separated by BOM and Weatherzone respectively and will give an indication of the rainfall intensity:
• White / Light Blue or Light Green > Light rainfall (typically less then 5mm per hour).
• Light to Dark Green or Dark Green or Yellow > Light to moderate rainfall (between 6 and 15mm per hour)
• Yellow to Orange or Light to Dark Orange > moderate to slightly heavy rainfall (starting at 20-30mm per hour and ranging up to 50mm per hour)
• Orange / Red to Dark Red or Red to Maroon > Heavy rainfall (anywhere from 80-200mm per hour)
• Maroon or Light Purple > Torrential rainfall (over 300mm per hour)
• Black or Dark Purple > Very torrential rainfall (over 360mm per hour)
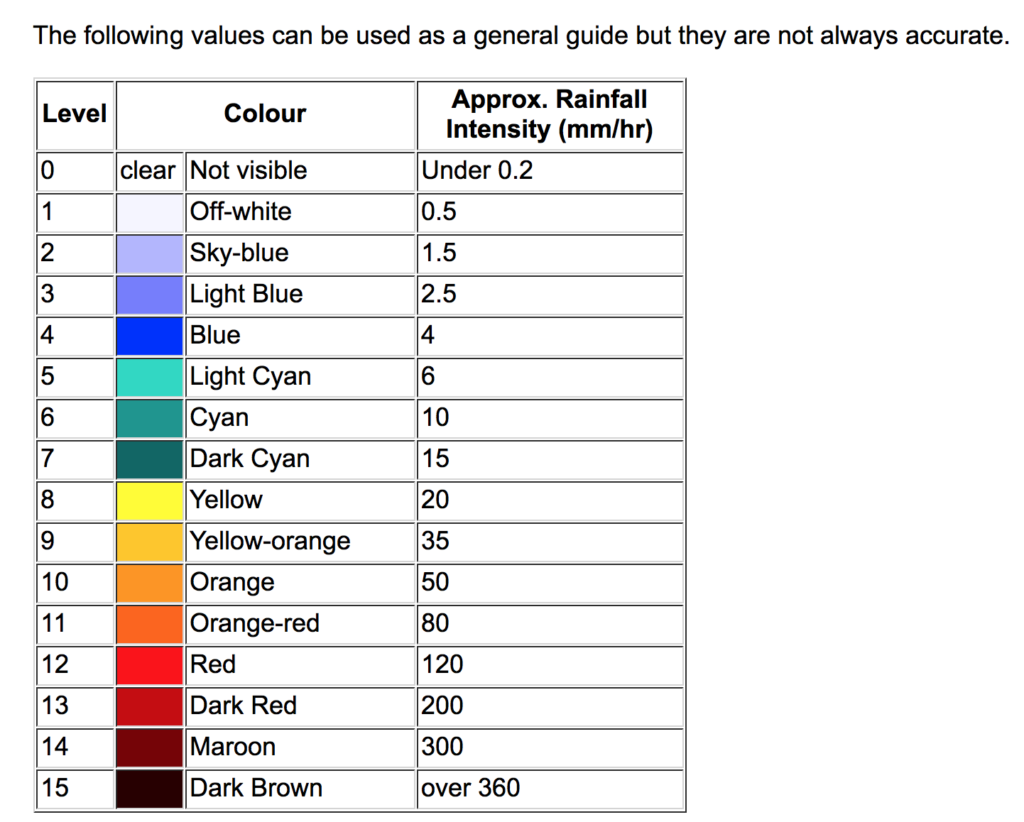
Radar colour guide via BOM
Its important to understand these are based on hourly amounts and the ranges go from the least amount (thats expected) and the absolute most.. As you can see, when you start entering the higher end of the spectrum, the rainfall rates become ridiculous (although they have actually occurred before), this is why when these colours are being projected on the radar screen we often refer to them as likely hail or large hail. This is due to the radar picking up the increased density and size of the hailstones compared to pure liquid and it reads it back as torrential rain. As stated just before, there are some cases where it has been very accurate in projecting pure rainfall.
Here are some of the highest rainfall rates in Australian history (click here for the full list):
• Adelaide, SA 11mm in 2 minutes
• Warawarralong, NSW 27mm in 3 minutes
• Toorooka, NSW 51mm in 6 minutes
• Wandoona, NSW 86mm in 10 minutes
• Moree, NSW 113mm in 20 minutes
• Bonshaw, NSW 174mm in 40 minutes
• Goonoo Goonoo, NSW 175mm in 30 minutes
• Towson (Laidley), QLD 176mm in 45 minutes
• Upper Ross, QLD 305mm in 120 minutes
Special mention has to go to Nobby in QLD. Nobby recorded back in 1939, 203mm in 20 minutes! This was just 3mm shy of the WORLD RECORD for a 20 minute period which is held by Curtea-De-Arges in Romania
Here are some of the world records for rainfall rates.. and let me tell you, they are ridiculous! (Click here for the full list):
• Barot, Guadeloupe – 38mm in 1 minute! This was verified and another nearby location recorded 25mm in 1 minute also.
• Fussen, Bavaria – 126mm in 8 minutes
• Holt, United States of America – 305mm in 42 minutes
• Shangdi, China – 401mm in 60 minutes
• Muduocaidang, China – 840mm in 6 hours (and 1400mm in 10 hours)
La Renuinon holds the majority of the records of less than 15 days duration (Cherrapunji, India holds all records greater than 15 days duration). These records include:
• Belouve, 1689mm in 18.5 hours
• Doc Foc, 1825mm in 24 hours
• Aurere, 2467mm and 3130mm in 2 / 3 days respectively
• Commerson which holds every record from 5 to 15 days, including 4301mm in 5 days, 5003mm in 7 days, 6028mm in 10 days and 6433mm in 15 days.
Anomalous Propagation (False radar echoes)?
Radar imagery is also renowned for keeping conspiracy theorists amused from time to time through the addition of false radar echoes showing things on the radar that aren’t really there. While this isn’t an often occurrence, it does happen regularly enough. The radar can also intersect things that are really there, but aren’t actually precipitation and then they appear on radar as precipitation… this is called anomalous prorogation.
• Ground Clutter: This is one of, if not the, most common blips on radar. Ground clutter is usually made up of non-precipitation objects such as dust, dirt, bugs etc. They typically appear close to the radar dome due to the beam being very close to the ground surface. Nearly every single, if not everything single, radar site in the world has ground clutter as nature is unavoidable. The obvious thing about ground clutter is that it doesn’t move.
• Super-refraction: This is when the radar beam is bent greater than normal back towards the Earth. If the bending is severe enough then the beam can actually intersect the Earth’s surface. This can cause an issue for distant precipitation as the beam doesn’t reach it, but if a very strong temperature (capping) inversion is in place with very high moisture levels, then the beam can what appears to be widespread showers and rain… however if its dry above the capping inversion, then a nearby radar will show nothing.
• Attenuation: Attenuation by definition is the weakening of a radar beam due to energy being lost to both scattering and absorption. The more intense rainfall that the beam has to pass through, the weaker it is beyond that individual area and thus the further away you get, the weaker the returns are regardless of how strong the actual thunderstorm or precipitation is. This can occur most often during tropical cyclones, as the amount of moisture and humidity in the atmosphere is maximised… heavy rainfall can be observed close to the radar. This can be a reason why rainfall intensity on radar sometimes doesn’t reflect hourly observations during tropical cyclones. Rainfall rates may only show intensities of 5-10 or 15mm per hour with pockets of 30mm an hour, when in reality rates of more than 50mm per hour may be occurring.
• Cone of Silence: The cone of silence is quite simple, its the tiny area around the radar origin that doesn’t project rainfall. It comes about like this because the antenna that sends the radar beam out, doesn’t reach 90º and therefore cant project right above the radar dome, thus creating an area around the dome that is precipitation-free.
• Butterflies, Bugs, Bats or Birds: Butterflies and birds can often be mistaken as precipitation on radar when they fly in large quantities or flocks. Due to the denseness of the “group” (whatever it may be), the radar beam inevitably hits many of the animals and returns that echo as precipitation. On radar animation, you can often see the flocks moving in synchrony and in a direction and you can also see their behavioural instincts such as birds flying in a direction, bats escaping caves and trees, butterflies exploding with flight, bugs along river and creek beds as sunset occurs.
• Chaff: Chaff is easily detected on radar during military operations. While the whole objective is for military to keep these operations a secret.. they often release a substance which is made of very light aluminium into the atmosphere called chaff. This substance is incredibly small and incredibly light that visually you won’t see it fall to the ground, but on radar it becomes detectable as light rain due to the radar beam reflecting off the aluminium pieces. Chaff can easily be caught in the mid to upper level winds and pushed in a certain direction.. this can make it look like a large rain band is coming. Chaff can also reflect the beam off itself into other pieces and amplify the overall effect that it has on the radar making it look much larger and more widespread than it really is. The whole purpose behind chaff is to “trick” enemy military personnel and missiles into thinking a target is visible on radar. The easiest way to figure out if its chaff or rainfall, is if there are clouds present. Satellite imagery doesn’t pick up on chaff, and so if there is rainfall on radar under clear skies… then its not rain.
• Fires: Strong fires can often appear on radar imagery. Either due to the fire being very close to the radar, the smoke plume rising from the fire being extremely thick, or a combination of both… the radar can often show this as light to moderate rainfall and even the direction of which the thickest part of the smoke is travelling. In a weird way, this can actually be somewhat beneficial because when approaching rain systems or storms are coming in, you can see how close they are to the fire (as the firefighters can use all the help they can get), you can see see if there is a change in wind direction that influences the fire, you can also see if the fire is growing or easing based on the thickness or intensity of the echoes.
• Sunrise / Sunset: For East Coaster’s it will be sunrise, for those in WA it will be sunset and if you’re in between… well as long as the radar has a clear view at the horizon its possible. The radar inevitably will pass through either the sunrise or sunset at some stage during the selected time periods. This can create a distinct line extending from the radar origin to the edge of the radar’s range.
• Interference: While this one can be categorised into many shapes, diagrams, sizes… you name it.. radar interference occurs and more often than people realise (because as stated above, this is technology and its not flawless). Interference is often caused by malfunctions with the radar (either with the radar dome, or the transmitter that gives us the available radar images), mobile phone tower signals, WI-FI and even other radars or radioactive waves passing nearby to the radar which disrupt its frequency. Often these images appears as crazy alienations of reality, where giant circles of rainbow colour eject from the centre of the radar to the range limit, or giant spirals appear on the radar, huge rings, a giant donut (also known comically as the donut of death).
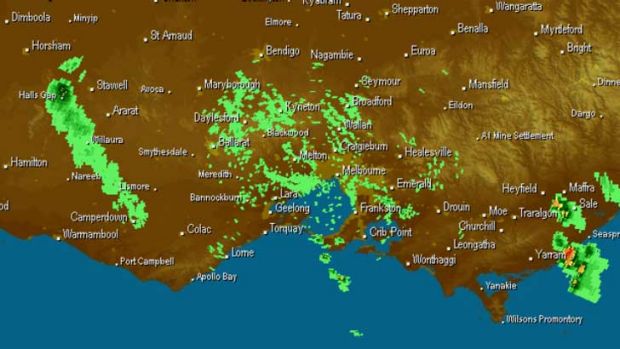
The Grampians Fire in January 2014 caught on Weatherzone radar (left of image)
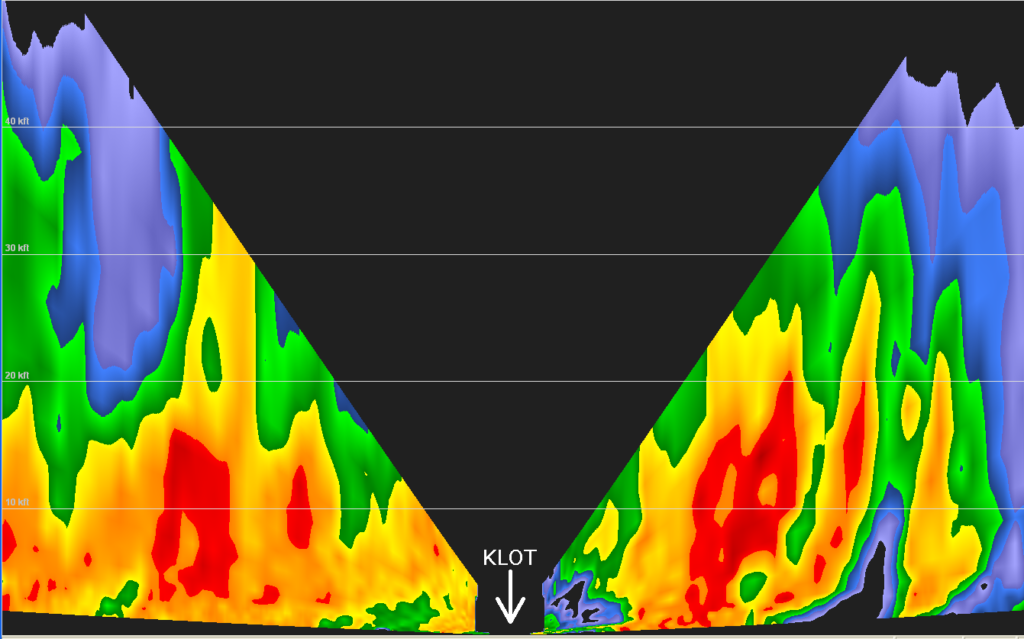
Side view of the cone of silence via Lake Erie WX
Sorry, the comment form is closed at this time.