04 Apr TC Debbie – one of Queensland’s worst cyclones
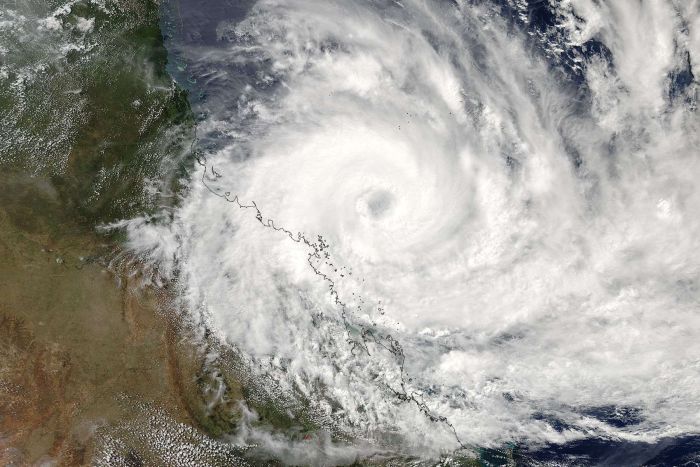
A week ago, newsfeed’s and media pages were being bombarded by Debbie as she took centre stage across global news. Debbie crossed the Queensland Central Coast 7 days ago, and while her devastation is still being felt, her impacts are still lingering and her heartache still present… there is a certain specialty about Debbie that we believe needs to be honoured as her raw officially recorded details will go down in history making her one of Queensland’s worst tropical systems. Above image via NASA.
Severe Tropical Cyclone Debbie made landfall over Hayman Island during mid morning between 8:45am and 9:30am on March 28th (last Tuesday) as a Category 4 system. Debbie then continued on a slow gruelling track where mainland landfall was recorded at about 1pm just to the West of Airlie Beach. Debbie became the first Cyclone to make landfall in the 2016-17 Tropical Season. Debbie also become the first Cyclone to make landfall in Queensland since Nathan in March 2015 (2 years, 1 week earlier). Debbie is also the fourth system in a row (Ita 2014, Marcia 2015, Nathan 2015) to make landfall at Category 4 strength or higher.
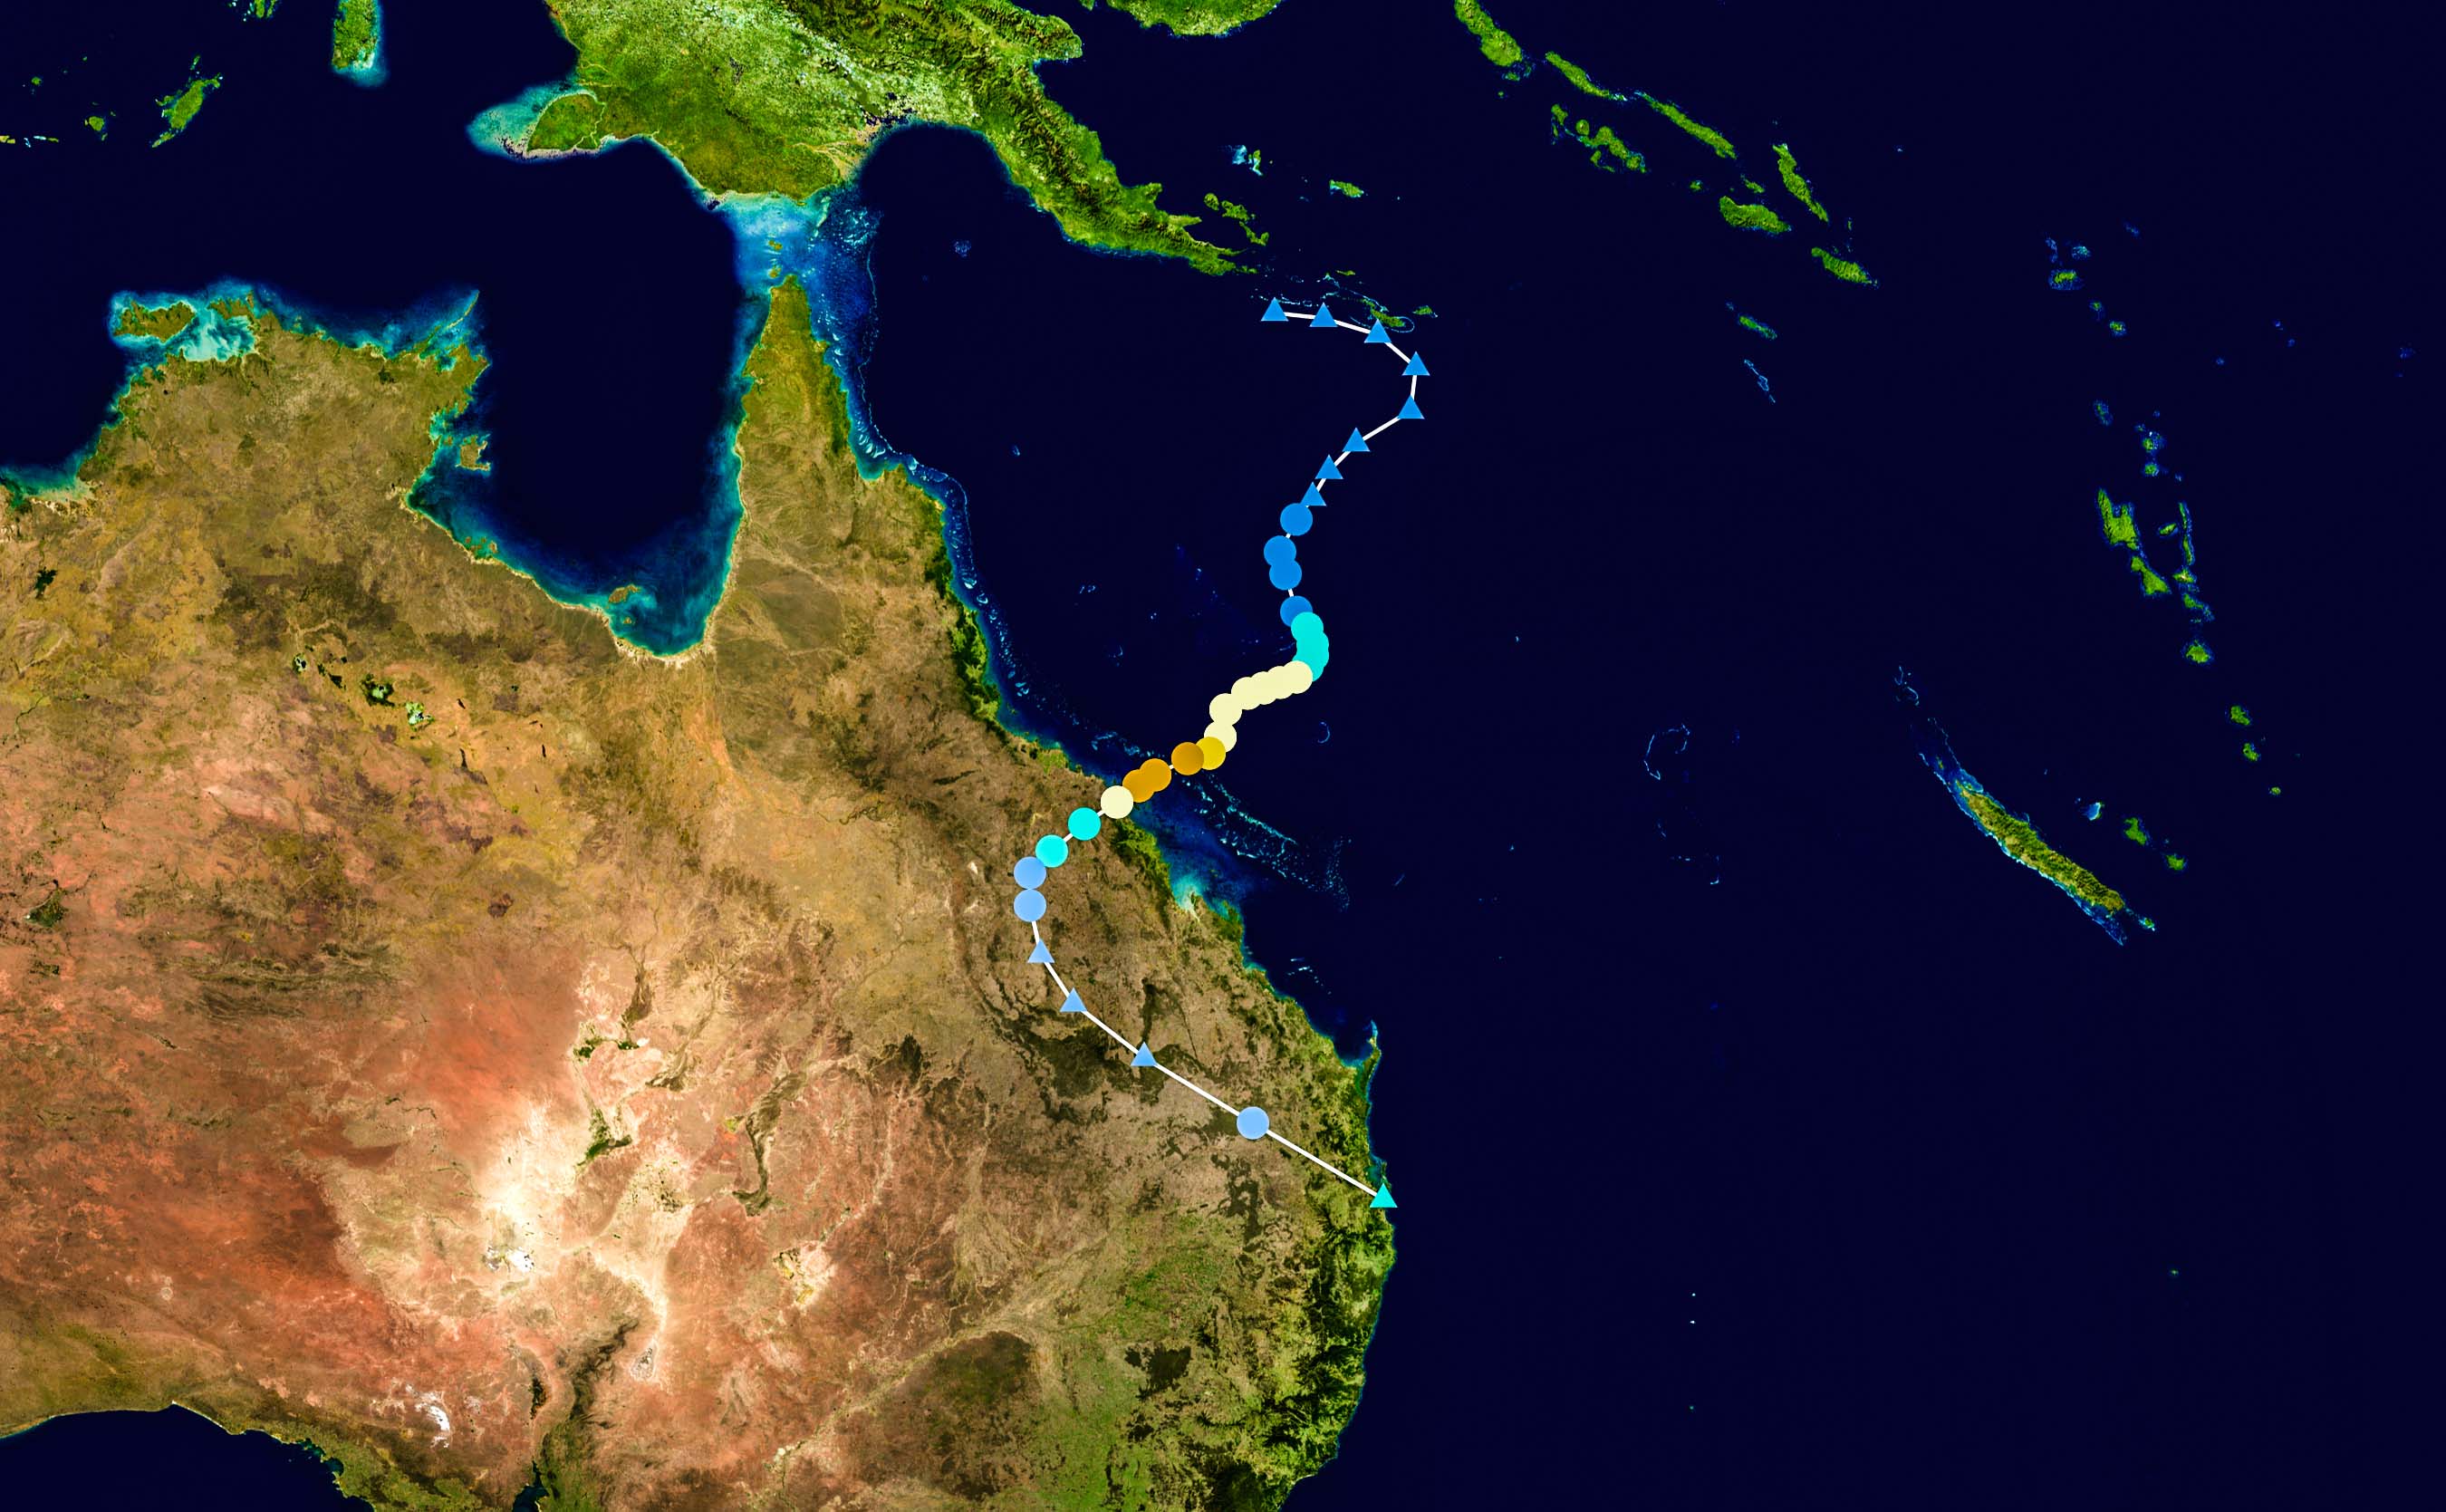
Severe TC Debbie track via Wikipedia
So what makes Debbie so insane? why is she being compared with Yasi, Larry, Marcia, Tracy and Oswald? Its virtually impossible to compare damage bills at the moment. Yasi tops all with $4.8-5B in damages, Oswald $2.28B, Larry $1.45B, Tracy $1.1B (1974), Marcia $800M. It will take a while for insurances to do their work and tourism industries to assess losses along with flood damage but initial estimates put Debbie at more than $1B and possibly higher (sitting somewhere between Larry and Oswald).
So apart from category and raw money, what other numbers does Debbie hold claim to?
Debbie officially recorded the strongest wind gust in Queensland, and second strongest in Australian history with a 263km/h wind gust observed at Hamilton Island. Unofficially, estimated winds from Yasi at South Mission Beach of 285km/h may have trumped Debbie. For argument sake, the strongest won’t be challenged – Barrow Island 408km/h during Severe TC Olivia 1996. Hamilton Island also saw wind gusts of more than 20okm/h for virtually 6hrs straight from 8am to 2pm roughly, and apart from the odd “low” gust, winds gusted to more than 150km/h for the best part of 15hrs straight (12:50am to 4pm).
Unofficial reports out of Airlie Beach saw winds to 240km/h and unofficial estimations of 125-160km/h at Collinsville, while officially Proserpine recorded 165km/h winds, Bowen 148km/h, Double Island Point 124km/h, 100-120km/h across South-East QLD, Coastal parts of the Wide Bay and Capricornia and across the Central Highlands.
Somewhat related to the winds, was Debbie’s overall size. During Debbie’s very early stages of life, the system measured in the vicinity of 1300km from the NW outer bands to the South-East outer bands which is a phenomenally large size (potentially second in size behind Yasi). When Debbie first developed an eye, it was roughly 100-120km in diameter also which is huge. Upon landfall, luckily the overall size dropped to about 400km and the eye size dropped to about 35km in diameter which meant the wind swath was far less.
Many cyclones produce phenomenal rainfall totals, especially the Coastal trackers such as Debbie and Oswald. While Debbie’s numbers aren’t the worst overall, they are certainly challenging the worst over a 48hr period. The only thing different between Oswald and Debbie would be Oswald was across 4 days not 2-3, and Oswald’s ridiculously high totals were far more widespread whereas Debbie’s widespread totals were more manageable and there were pockets of insanity.
Top 10 Rainfall (mm):
Mt William 1328
Undercliff 1198
Clarke Range2 1157
Clarke Range 1023
Marian Weir 907
Upper Springbrook 896
Crystal Brook 881
Upper Finch Hatton 809
Sarina 801
Hannaville 795
Highest Daily Totals (mm):
Clarke Range2 646
Upper Springbrook 602
Mt William 568
Undercliff 544
Clarke Range 535
Undercliff 532
Couchy Creek 507
Boat Harbour 478
Mt William 470
Terania Creek 466
Highest 2 day totals (mm):
Undercliff 1076
Mt William 1038
Clarke Range2 986
Upper Springbrook 890
Clarke Range 861
Queensland rainfall for the week ending April 4th via BOM
Flood records were also not only broken by smashed by Debbie. Rockhampton is on the brink of recording its third highest level for the Fitzroy ever, while Murwillumbah, Uki and Lismore’s 1954 record for the Tweed was obliterated by up to a metre or more. The Logan and Albert River’s challenged the 1887 record in Logan and the Northern Gold Coast while Beaudesert went 6m above major smashing the 1991 record by more than 1m. This widespread flooding has unfortunately impacted many people and tragically also taken lives from us. Any cyclone with a major damage bill is bad, but one that takes lives is worse and we feel for the family and friends who have to deal with their grief. Our thoughts go out to them through a very very difficult time.
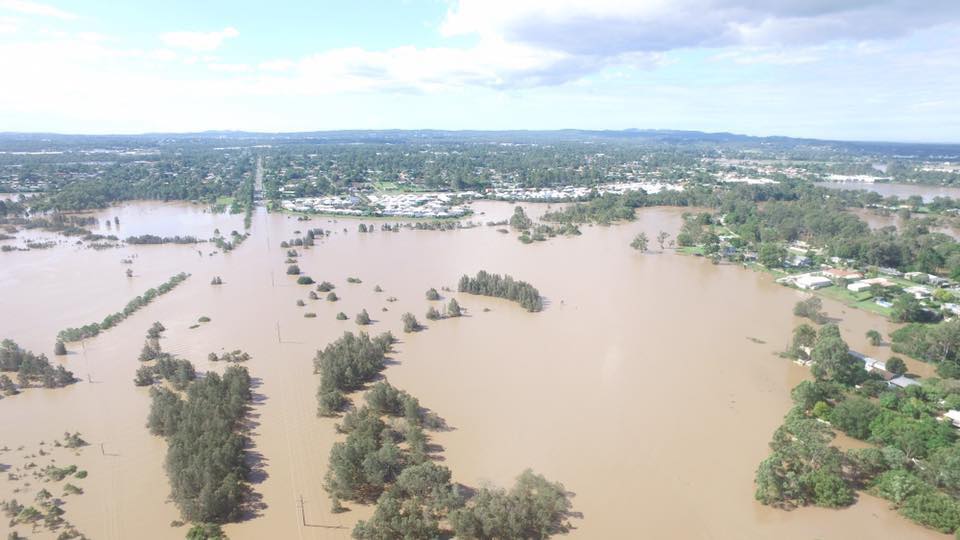
Major flooding at Logan via Andrew Rich
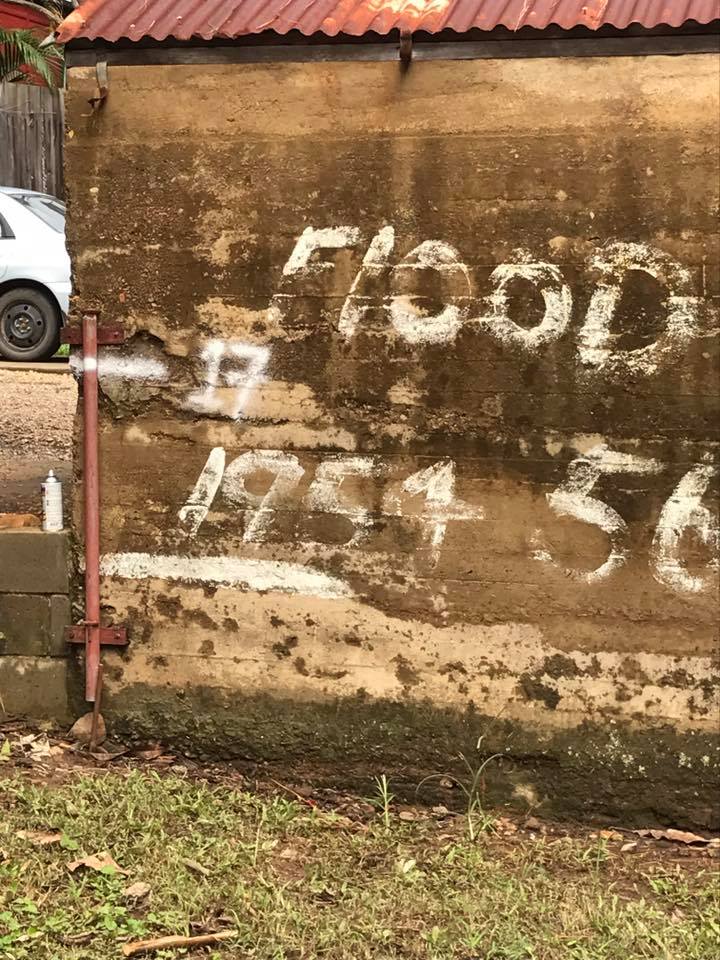
The 1954 flood line broken in Murwillumbah
Whether or not Debbie’s numbers stack up against the worst of the worst, her overall impact will be longly regarded as something significant not only in Queensland, but Australian’s weather. Her impacts will be felt through millions of households for a long period of time and her name will forever be remembered like the monsters mentioned earlier in this blog.

Sorry, the comment form is closed at this time.