What is a La Nina Weather Pattern & What are its impacts??
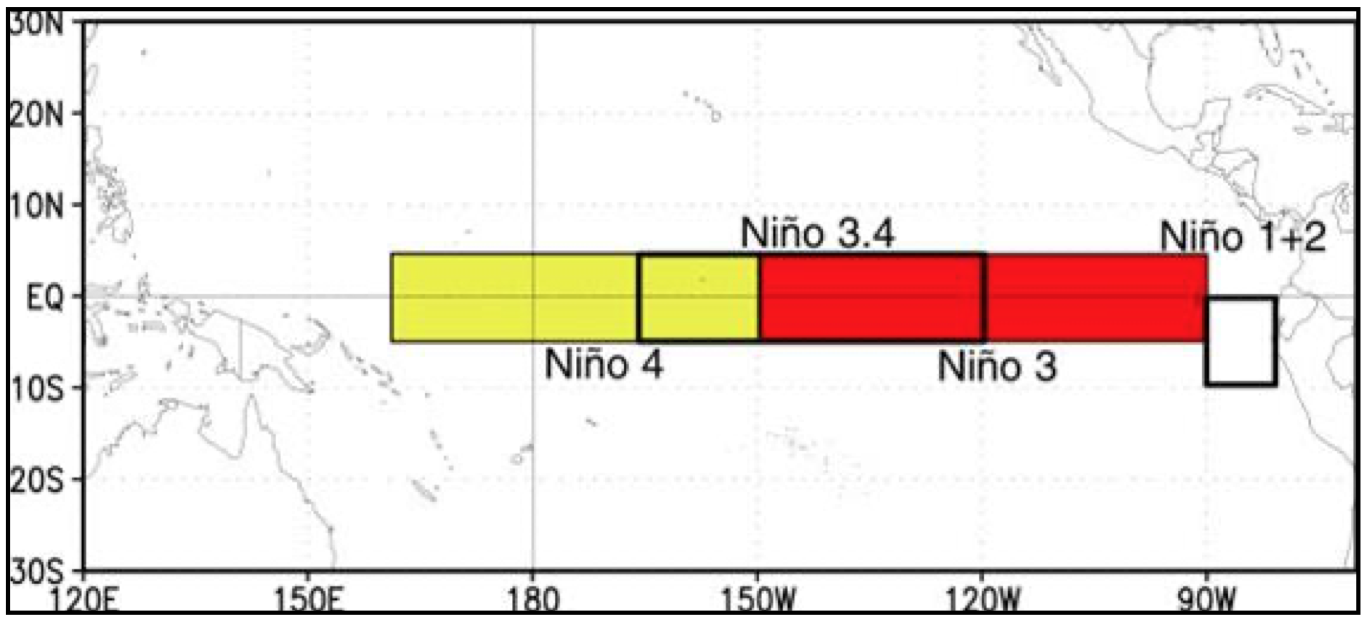
ENSO PATTERNS: ENSO is the abbreviation of the phrase ‘El Nino-Southern Oscillation”. This pattern is a large driver for long term weather conditions across Australia (as well as many other countries across the world) and these weather conditions are heavily dictated by which ‘phase’ this ENSO pattern is currently in. The El Nino-Southern Oscillation is largely considered to be the ‘most’ important climate phenomena on Earth due to its ability to drastically change global atmospheric conditions both in the short and long term. The ENSO pattern can be broken down into three different phases. These include: ’La Nina’ and ‘El Nino’ which are opposing patterns and ‘Neutral’, with ENSO also being broken into 4 different sections – each playing a significant role for different countries across the Pacific. The main focus for Australia is the Nino 3.4 and Nino 4.0 values.
HOW ARE ENSO VALUES OBTAINED: The ENSO values signify the anomaly for sea surface temperatures in a belt across the Pacific Ocean, starting off the Coast of South America (around Ecuador / Northern Peru / Southern Colombia) and travel across the Pacific towards Australia, Papua New Guinea and the Pacific Islands. Basically, NOAA has 8 satellites in two different orbits around the Earth – these are either geostationary or polar. These satellites are designed to measure the sea surface temperature by checking energy levels radiating from the ocean at different wavelengths. Computer programming then plots these measurements into a gridded map, merges and then smooths the data. Each grid is approximately 5km x 5km – which is extremely small, so the data is very precise. The computer programming then takes what it is calculating and seeing, and compares that to the monthly average which it has already obtained from previous data. A positive value indicates warmer than average sea surface temperatures, a negative value indicates cooler than average sea surface temperatures. Once the anomalies reach a certain threshold (+/-0.8ºc from average for BOM, +/- 0.5ºc from average for the rest of the world) this result then becomes ONE factor of a La Nina or El Nino weather pattern being declared.
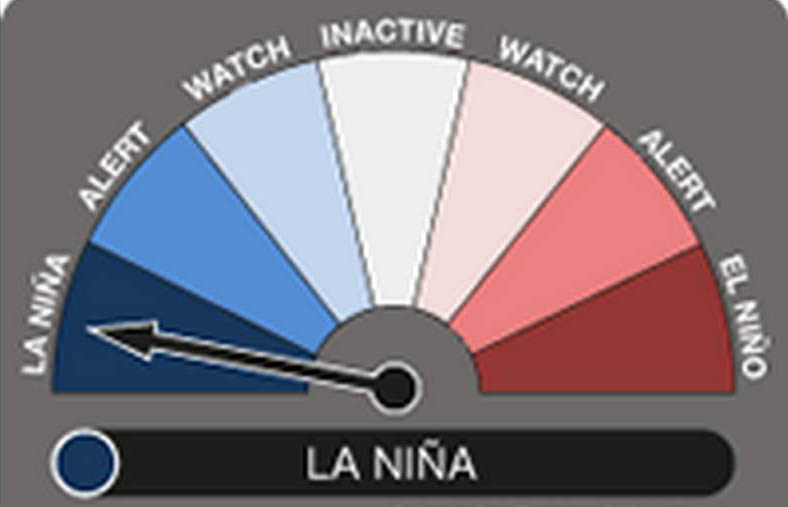
A list of historic ENSO patterns can be found HERE with blue indicating La Nina, white indicating a Neutral phase (neither La Nina or El Nino) and red being El Nino.
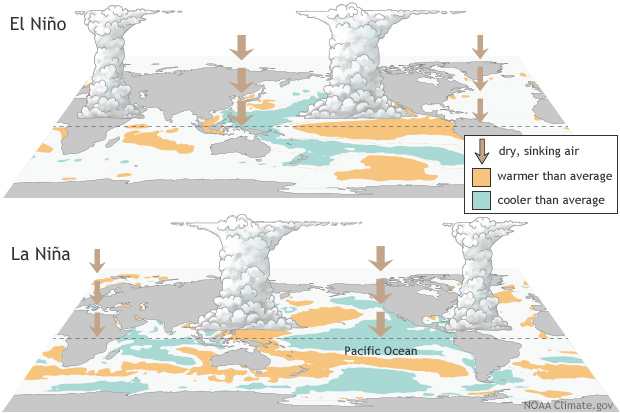
WHAT IS LA NINA & WHAT ARE ITS IMPACTS? La Nina is the terminology given when the ENSO phase is featuring cooler than average sea surface temperatures. For BOM standards, the thresholds need to exceed 0.8ºc below average for La Nina to be declared, whilst the rest of the world it needs to be 0.5ºc below average. A La Nina climate pattern allows cooler waters from South America to travel across the Pacific Ocean and reach Australia. These cooler ocean temperatures are often met with East to West oriented trade winds and the combination of these two factors more often than not, results in above average rainfall across Eastern Australia as well as cooler than average temperatures. The two theoretically go hand in hand with each other, as more rainfall leads to more precipitation (obviously), which typically will mean more cloud, which allows for less heat to reach the Earth’s surface and thus resulting in cooler conditions.
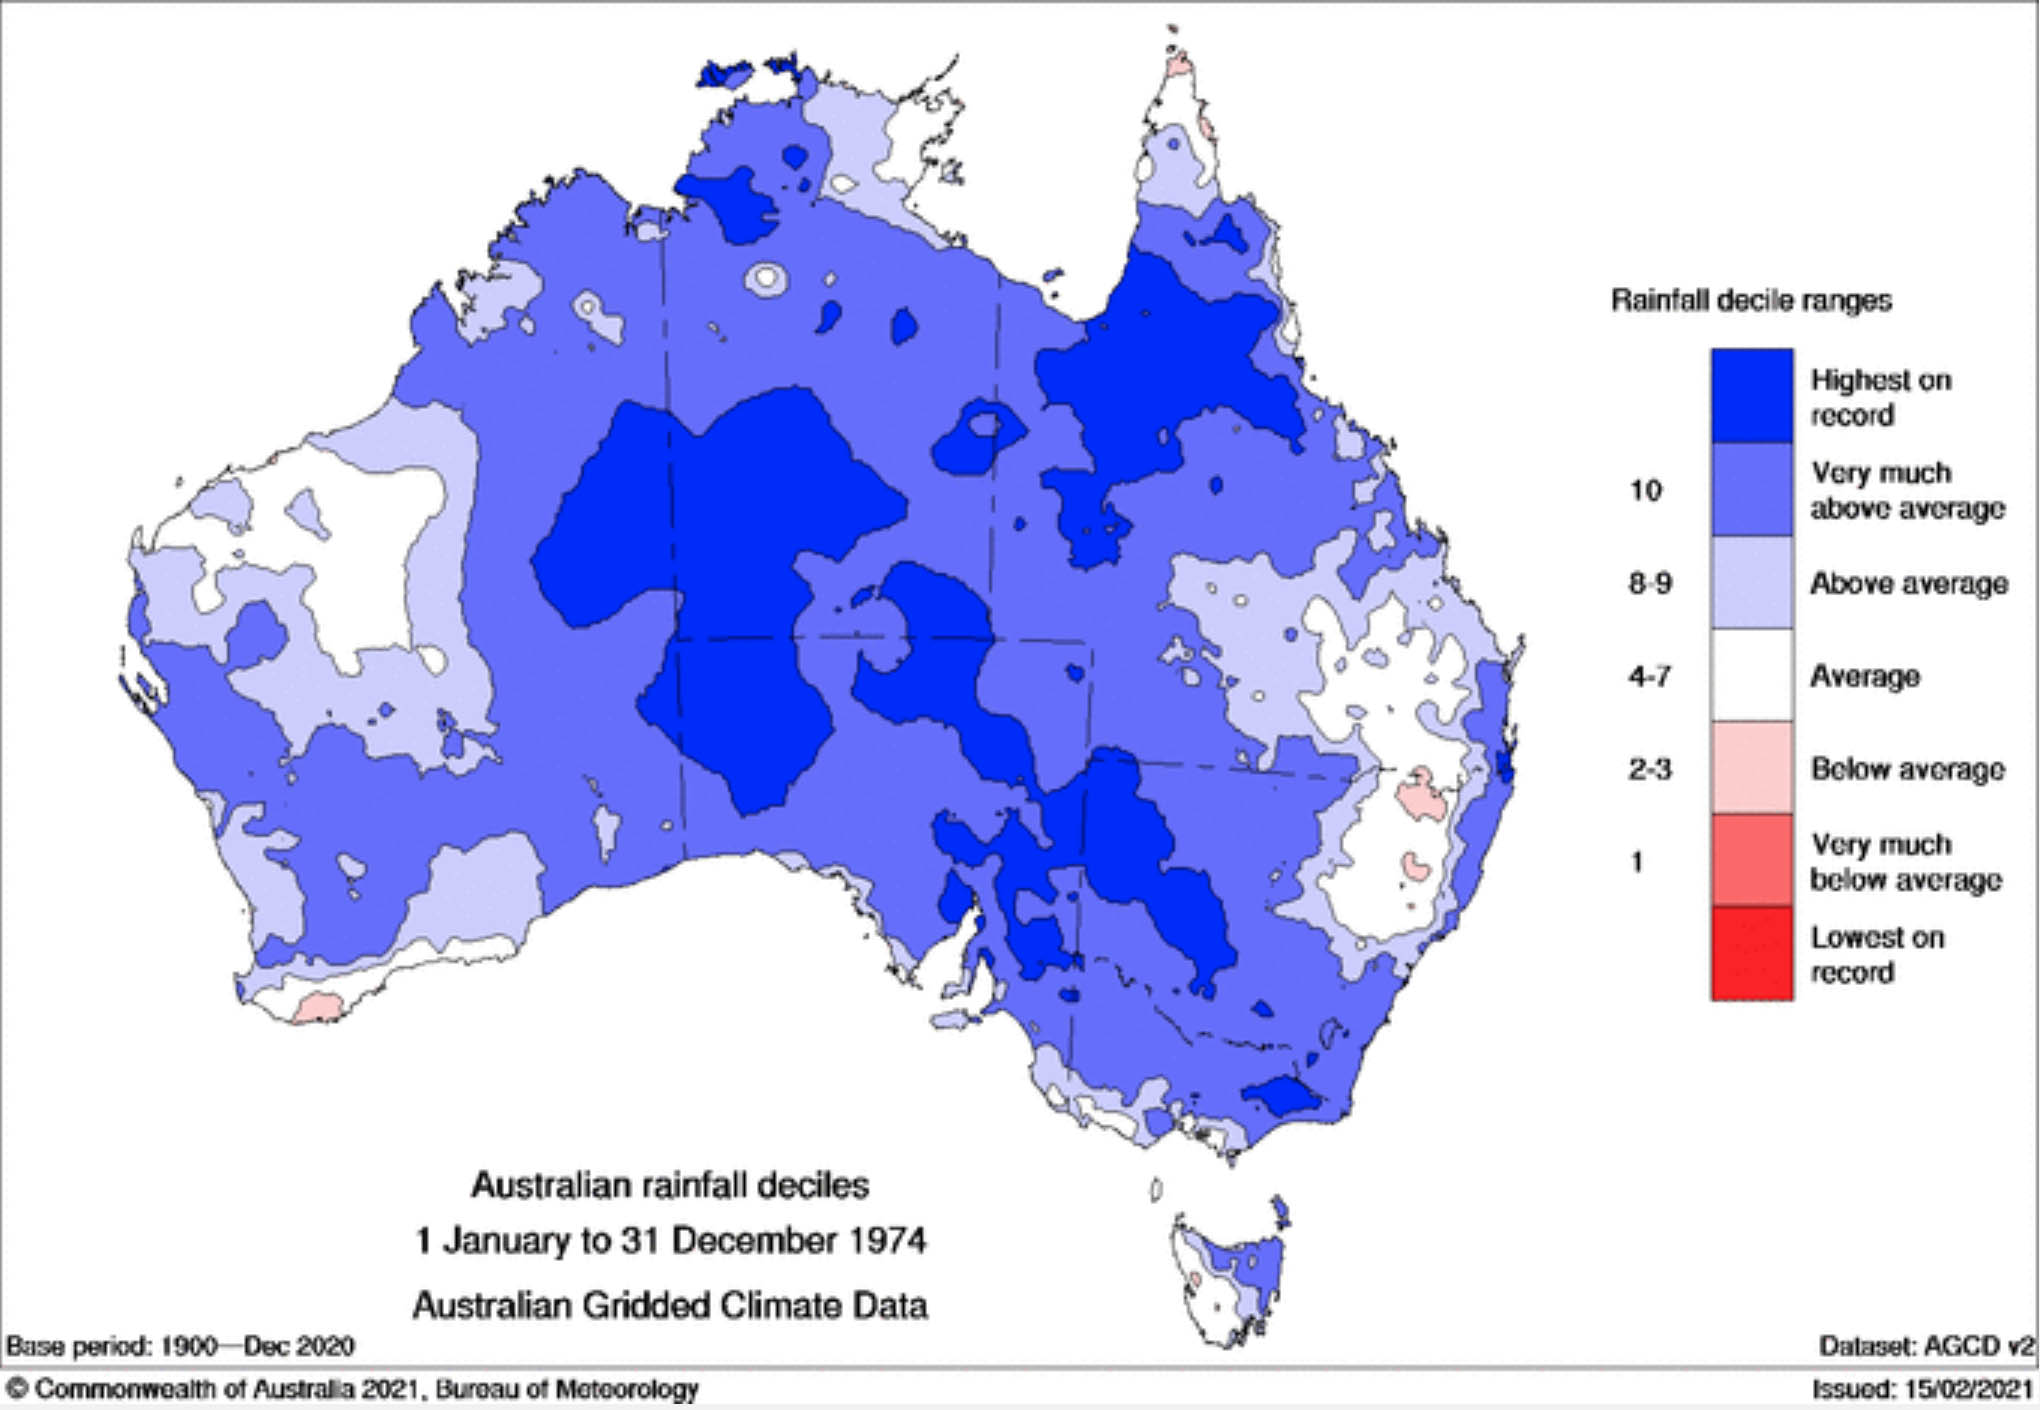
Despite the general consensus being ‘above average rainfall’ for the Eastern States of Australia – typically during a La Nina pattern, somewhere still misses out and depending on the specific area or location, this can be for a number of factors. These factors include the Southern Annular Mode (SAM) which is a strong influencer for pushing upper level troughs further North or keeping them further South. The positioning of the monsoon trough / MJO (Madden-Julian Oscillation Index) is also a factor as this can be a dictator for not just tropical development but also how the winds impact the Tropics. The strength of a La Nina can also be a dictator of rainfall, as it may heavily impact some locations but also may be ‘too strong’ for others which it becomes a barrier for things like the Indian Ocean Dipole. Historically also, consecutive La Nina patterns are much rarer than consecutive El Nino patterns – so the overall long term impacts of a La Nina phase are often shorter than those of El Nino. Interestingly though, the overall impacts of La Nina become far more widespread historically when a second consecutive La Nina occurs, and even more widespread if a third consecutive La Nina occurs (we are yet to have a fourth consecutive La Nina year in Australia based on recorded data). One of the most powerful La Nina events on record is for 1974. This is the only year where we have a triple La Nina combining with a negative Indian Ocean Dipole (basically moisture being pumped into Australia from both sides). As a result of this, the entire country apart from a very small area of the Darling Downs in QLD, the North West Slopes and Plains in NSW, Western TAS and Far Southern WA saw above average to record breaking rainfall – Cyclone Tracy in Darwin and Cyclone Wanda in Brisbane were both major players in this combination also, as well as many other tropical systems making landfall over WA, QLD & the NT before moving Inland.
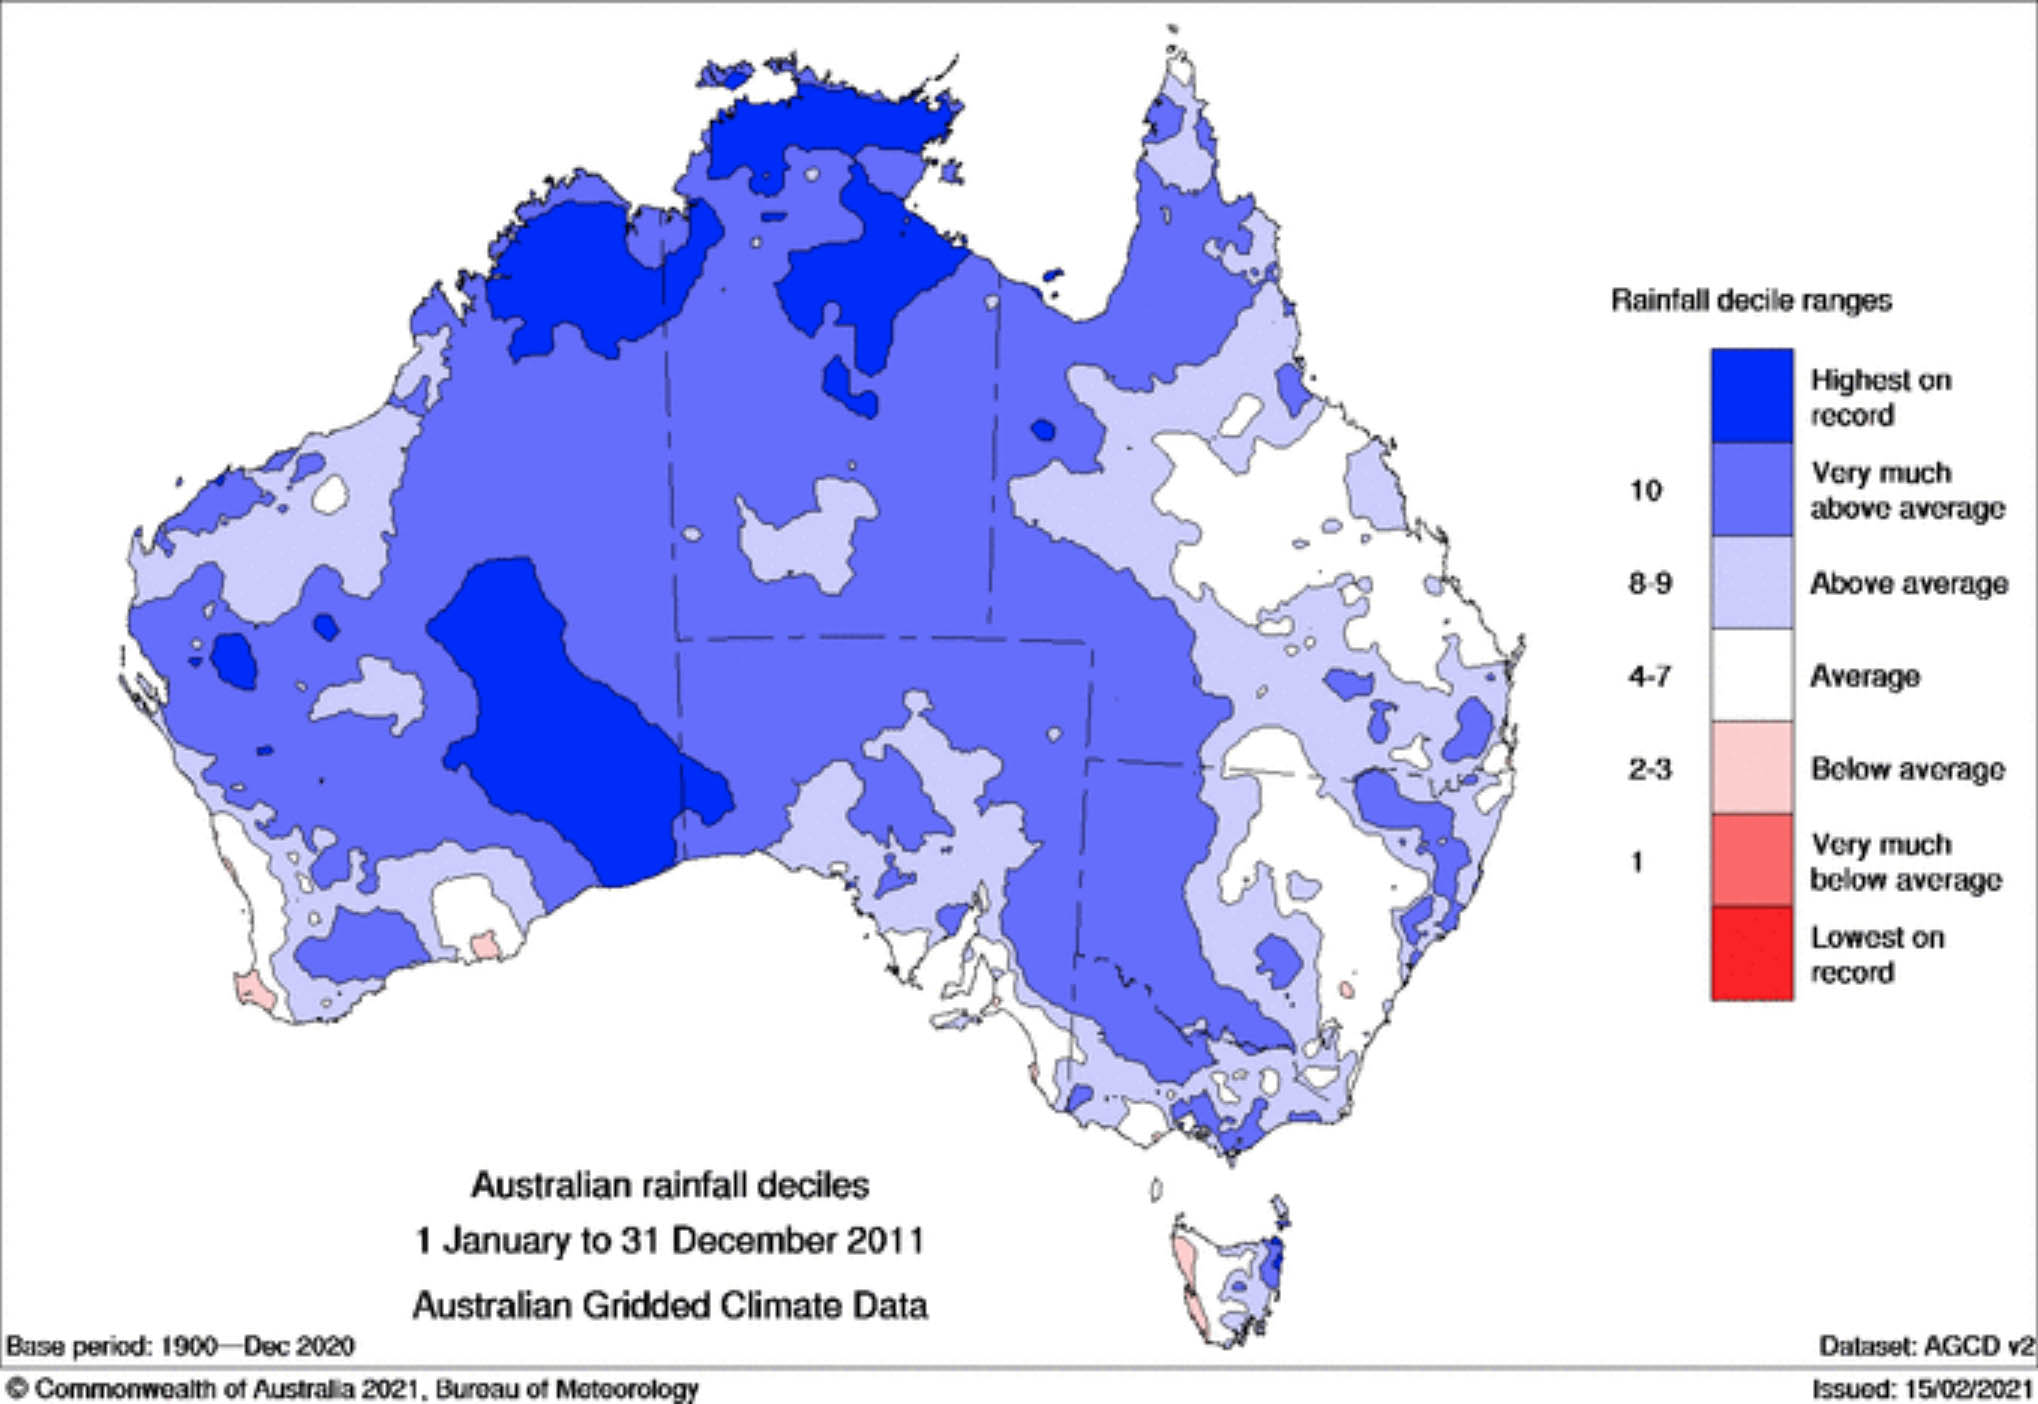
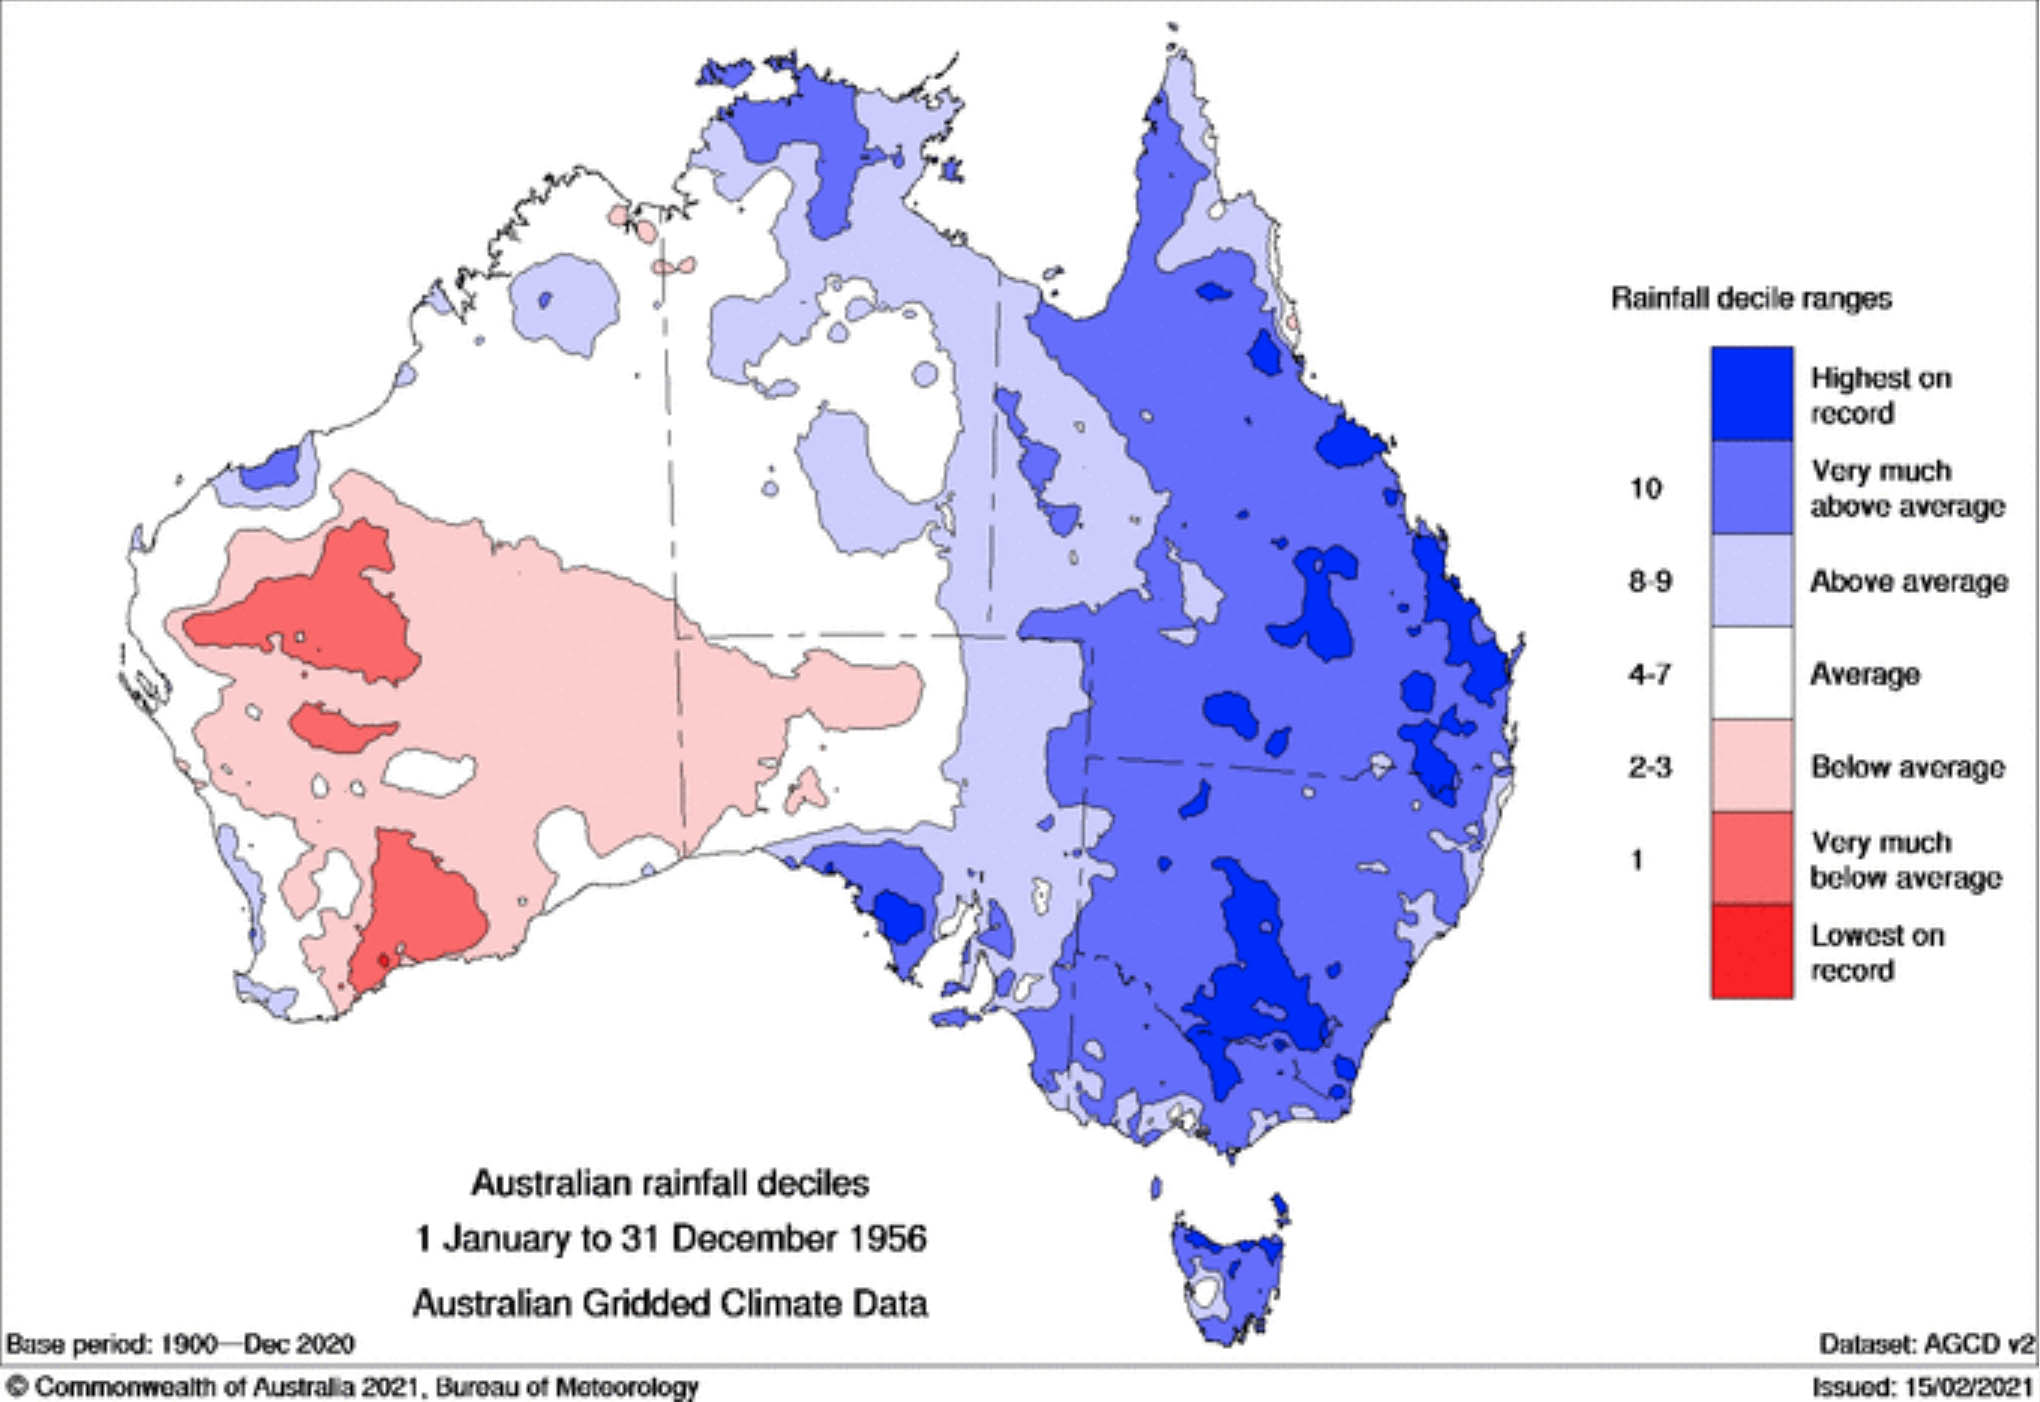
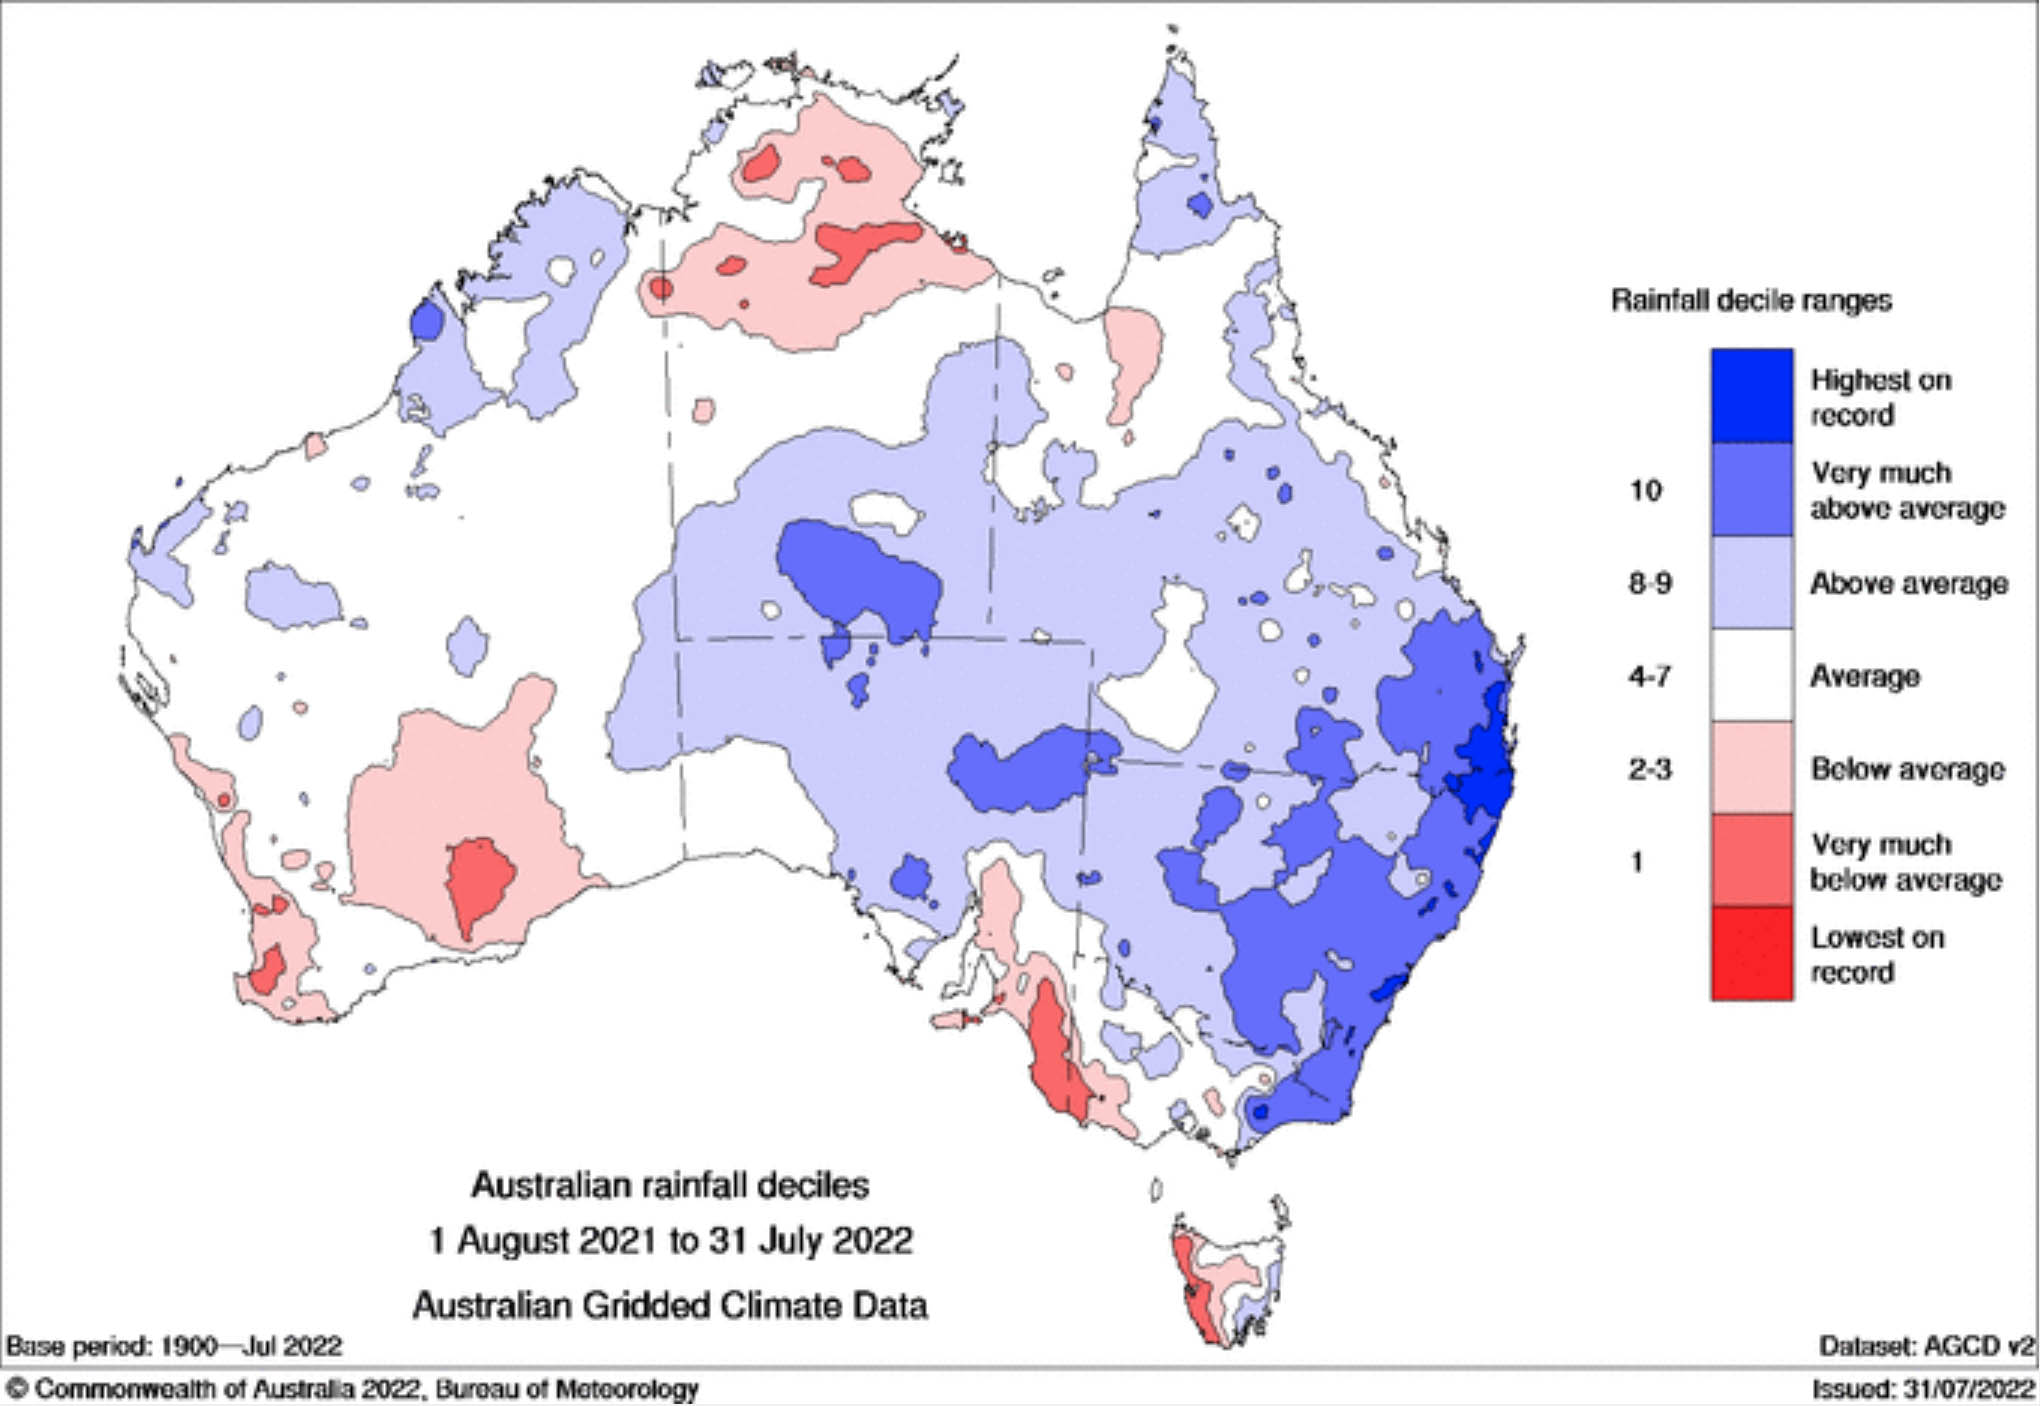
The below images represent La Nina years for 2011, 1974, 1956 and mid 2021 to mid 2022 – these are some of the strongest and most well known La Nina periods for Australia. You can see while the general consensus is above average rainfall (below shadings), there are still localised areas that miss out (red shading).
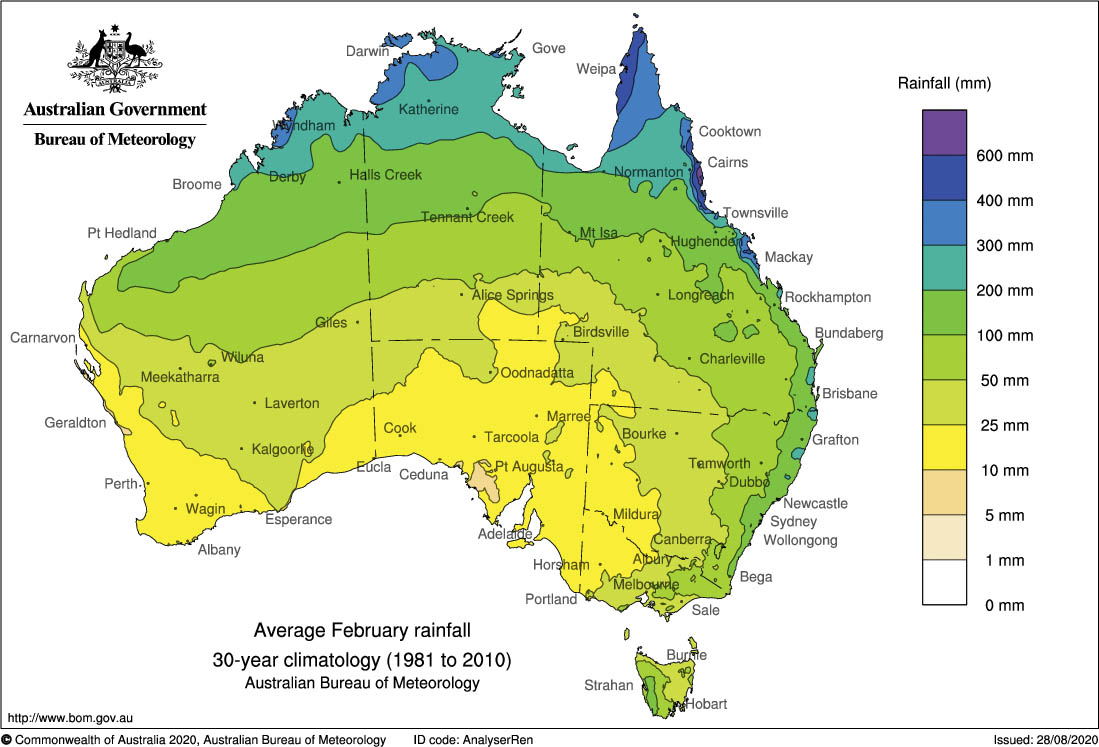
Even though flooding is a common thought when it comes to a La Nina being declared, and rightfully so… a La Nina never ‘guarantees’ flooding however. As stated above, historically in a single La Nina year, often someone misses out. In addition to this, La Nina is more of an indicator of ‘above average’ rainfall and ‘above average’ rain days. A La Nina pattern in September will have a considerably different outcome to one in February or March as the averages between these months are vastly different. September being the driest month for QLD may mean that places who average 20mm, see 40mm (yes thats double, but 40mm as a whole isnt a lot). Places in February though who average 150mm, could average 300mm or more – this is the same anomaly (200%), but the difference between 40mm vs 300mm+ is huge. La Nina can also play a role with the pure storm season which is typically more focused around Spring, with Summer tending to lean more towards monsoonal activity. We tend to see more tornadoes and giant hail events during La Nina years as there is so much moisture being fed into upper level troughs and cut-off lows over Eastern Australia. We also tend to see more ‘high precipitation’ thunderstorms leading to flash flooding which can eventually result in some river and creek flooding depending on frequency. Similarly, while La Nina weather patterns often lead to at least average, if not above average tropical cyclone numbers – there are a number of instances where below average cyclones have occurred (largely due to other circumstances coinciding with La Nina such as a La Nina Modoki occurring (explained below), the positioning of the monsoon trough / Madden Julian Oscillation being unfavourable, increased vertical wind shear resulting in tropical lows struggling to become tropical cyclones etc).
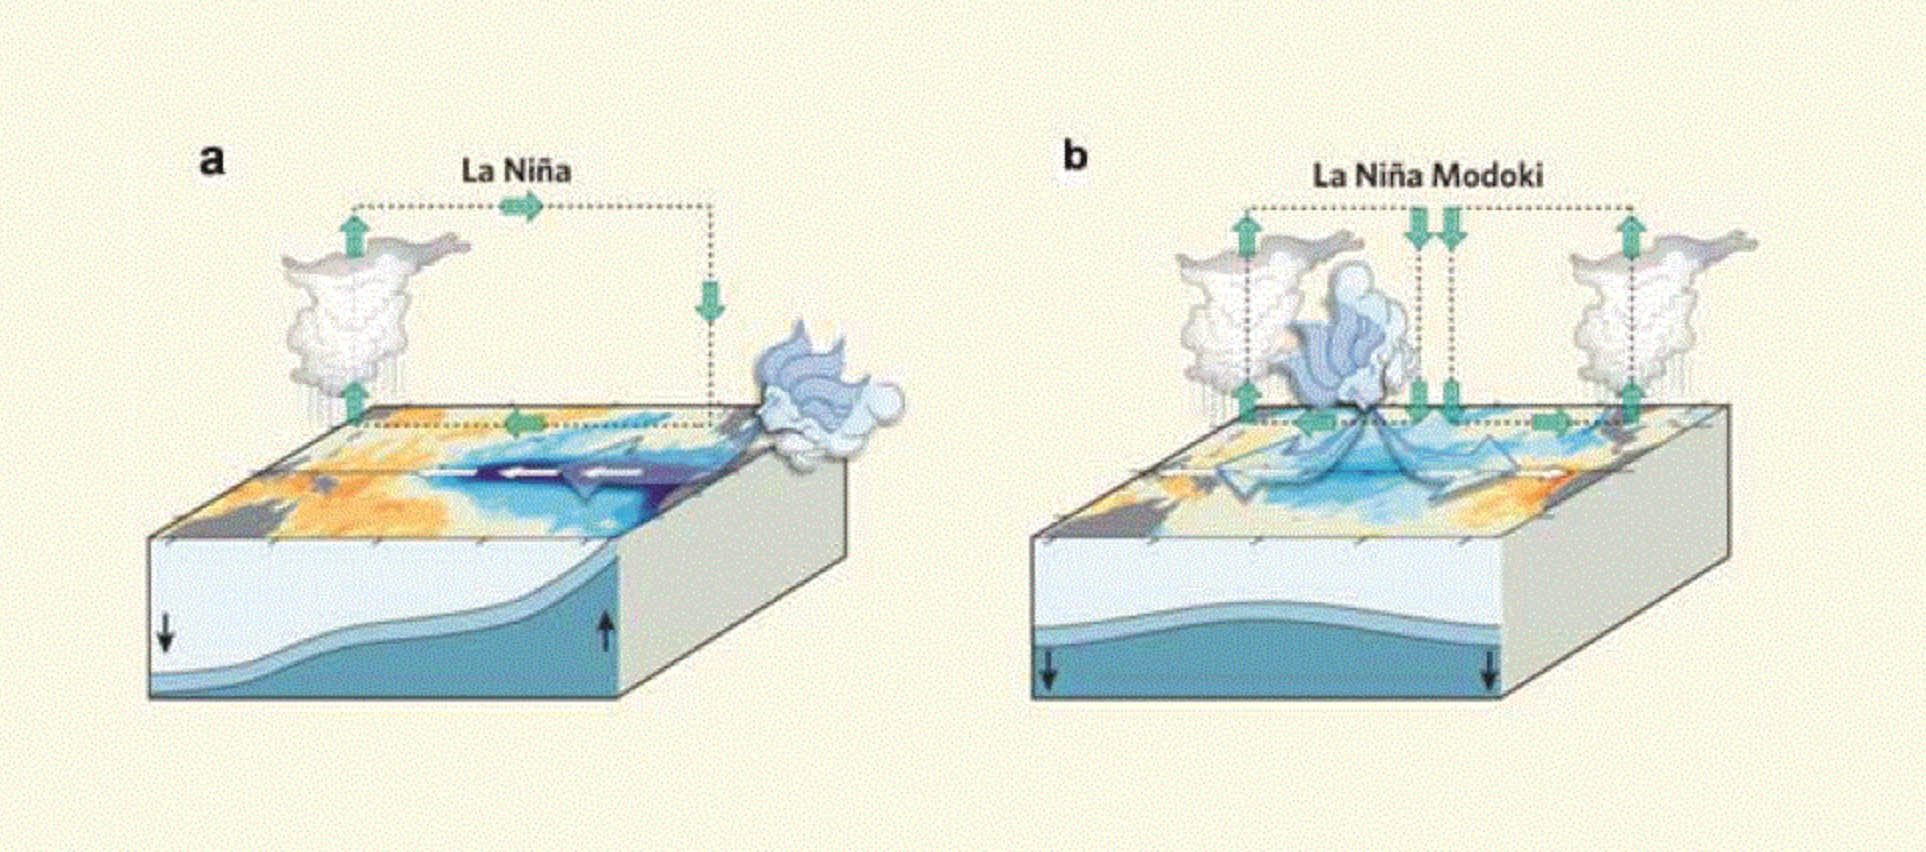
There are also different types of La Nina with a ‘Modoki’ La Nina and ‘Central Pacific’ La Nina being the main two for Australia. These types of La Nina ‘sometimes’ actually lead to below average rainfall across Australia – but not always. This is largely due to these types of La Nina patterns interacting with other characteristics which are different to a traditional Eastern Pacific La Nina. An example of this is a Central Pacific La Nina (where the temperature anomaly for Nino 1 & 2 is near normal but 3.4 is below average) tends to produce increased rainfall for North Western Australia and the Northern Murray-Darling Basin rather than over Eastern areas such as a conventional Eastern Pacific La Nina. A Modoki La Nina tends to result in increased frequency of tropical cyclones / tropical storms over the Bay of Bengal, but decreases tropical storms over the Indian Ocean and extremely infrequent storms over the Arabian Sea, which subsequently impacts Australia in a negative way.


Sorry, the comment form is closed at this time.